Your comments
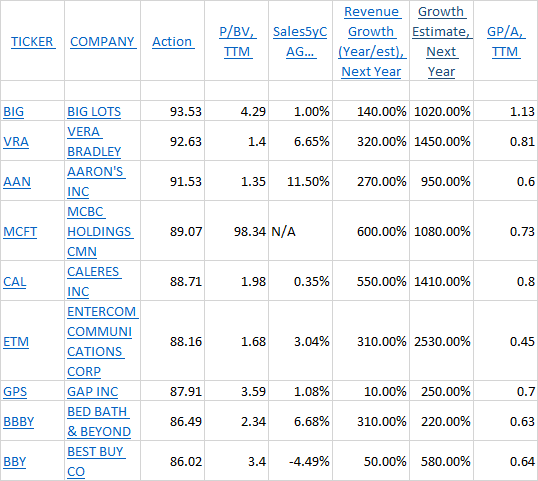
Here is example of display errors I am referring to for Revenue... and Growth... columns in a custom screener:
Thanks for that adjustment, but what I proposed is slightly different -- It takes it one step further and makes it much, much more flexible and useful for us users.
For example, let’s suppose for one of my screens, I am in the OSV Ratings category and sort the Piotroski column so all the 9 companies come to the top of the list. Then I want to view other metrics (in other categories such as Valuation, Estimates, Solvency, etc.) for those same Piotroski=9 companies. I should be able to do that without the program always automatically switching the list order back to the Action Score order. It is easy for me to manually switch back to the Action Score order if I want to, but what is really helpful is scanning across all the categories and their metrics for a particular sort metric that I choose as important to me. In short, instead of being able to sort on ONLY the Action Score, I would then be able to sort on any column heading metric. How cool (and exponentially more helpful) would that be?
I hope I’ve explained this in a way that is understandable.
Thanks for your consideration.
Have you considered using Industry from line 469 in the Metadata section? I'm not sure, but perhaps that might be a NAICS 5-digit Industry designator, in which case there are 215 unique Industries. If so, perhaps selecting 4 largest market cap companies in that Industry as an initial automatic load would be a reasonably good starting point? Of course, each user would then be able to manually change/save competitors as they choose -- but would also have an option to revert back to the original automatically loaded list as well.
Thank you for adding GPA numbers for prior 5 years and TTM to Dive-into-Data/Key Stats/Key Stats tab.
However, regarding your reply "Sales 5 Yr + TTM" will show a few
values only because it is comparing against data 5 years ago. That's
why we decided not to include it as it doesn't fit in with historical
data." It seems you think I'm suggesting you include the 2 Sales-related Growth stats under the Dive into Data/Key Stats/Key Ratios, but instead I'm suggesting these 2 Sales-related data points be included in the Dive-into-Data/Key Stats/Key Stats tab. The stats now showing in this tab overemphasize V-related stats, are adequate in Q-related stats, but neglect G-related stats (namely the 2 Sales-related metrics). Thank you for your re-consideration.
By the way, just so you'll know, I'm definitely not trying to nitpick. You have a great app, but I'm just trying to make some small contributions in improving its functionality to help move it from very good, then to great, and ultimately to outstanding. I know you're working diligently on improving it daily and I'm encouraged by your diligence and commitment. Keep up your great work.
Regarding 2 Sales-related metrics not shown at all in Dive into Data, please show them in Dive-into-Data/Key Stats/Key Stats tab. In that tab now are a slew of Valuation metrics and all Quality metrics used in your QVG model, but 2 Sales metrics are missing.
GPA is listed but numbers are missing in Key Stats/Key Ratios area. Please add.
Customer support service by UserEcho


Hi Ra'uf,
You are right in the sense that NCAV and Net/Net stocks were more prevalent decades ago and are very rare in modern times. I fear those that do pass these strict filters now are often 'value traps' rather than 'true values'.
Currently, the OSV online app has 3 Valuation models (DCF, Graham, and EBIT). When Jae chooses what model to add as a 4th one, my preference would be for a 'Buffet' model. Jae is already researching Buffett's stock selection methods/metrics -- see most recent post on his blog Like Buffett and Beyond
Your thoughts?
Jae, do you have a plan yet for what the 4th Valuation model will be?