Your comments
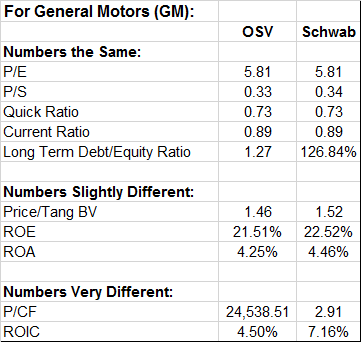
Excellent topic. I was just looking at GM. OSV has ROIC for FY2016 as 4.50% and Schwab has it as 7.16% -- a big difference. Schwab's formula is

Other 'Valuation' Ratios comparisons for GM are:

FYI, Schwab P/CF formula is:
Current Price divided by Cash Flow Per Share for the most recent fiscal year. Cash Flow is defined as Income After Taxes minus Preferred Dividends and General Partner Distributions plus Depreciation, Depletion and Amortization.
Share Price (as of last close)//Cash Flow Per Share (MRFY)
2.91
Another example I was just looking at:
In 'Step 3 -- Valuation' models, 'Growth Rate' for GM is +5.21% for DCF model and +9.42% for Graham's Formula model. As with BAC example above, DCF model 'Growth Rate' seems more realistic.
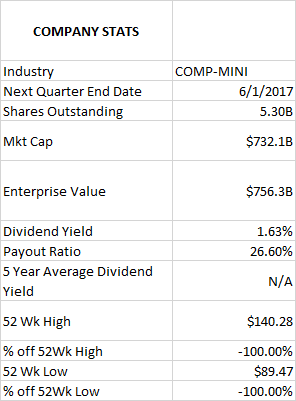
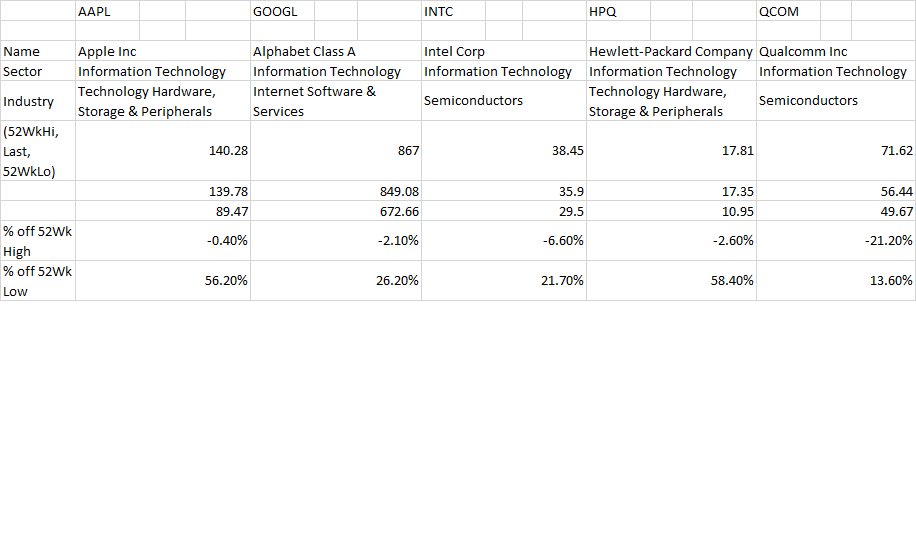
Using Apple Inc. as an example, -100% error displayed below for both '% Off 52 Wk High' and '% Off 52 Wk Low' in 'Dive into Data/Key Stats category/Key Stats column heading tab':

Note: the correct numbers are shown in the 'Compare Competitors' category:

Hi Dan,
Data grab from OSV screens.
Great news! That will be a terrific advancement in usability and flexibility. When designing it, please also include that once in Screener page (also applies to Stock Database page), we should be able to move back and forth from category-to-category across the top of the screen (i.e. Basic, OSV Ratings, Valuation, ... etc.) while staying in Screener and also maintaining whatever the current ticker list order is (until we change the list order by either sorting on a different column heading or switching to another Screener Name. We wouldn't leave Screener (or Stock Database) until we choose to do so by selecting a different Step category in the left sidebar (such as Home, Summary, .... Compare Competitors, Financials). Thank you!
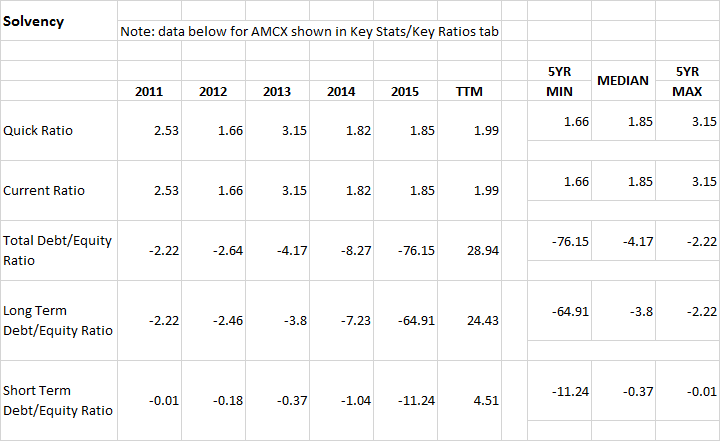
P.S. Numbers for most companies are accurate, but you can see several companies that are not. Also, several instances where debt/equity ratios are displayed as negative numbers (which I don't think is possible).
Near future? I know my vote doesn't count, but this is #1 on my Wish List.
Would you please explain what the 'roadmap' is? Is it the same or different than when you mark an Idea as 'Planned'?
Is 'roadmap' a list of priorities and the timeline for when you plan to complete them?
When you post replies to the submitted 'Ideas' and 'Bugs', it would be helpful to us if you would also give us some clue as to when you expect to complete them -- for example, within a few days, within the month, this summer, etc.
Thank you for all you are doing.
Explanation in original post was adequate, but here's more detail:

Also, here is default display in Dive into Data section:

Customer support service by UserEcho


Not sure, but perhaps inconsistencies identified in my prior post 2 weeks ago might be from usually using Non-GAAP EPS, but some data points being GAAP EPS. Here is an example for ESRX using default settings:
Suggest not mixing non-GAAP and GAAP numbers for any particular company. Also, make it clear to users somehow whether numbers for that company are GAAP or non-GAAP. Thank you.