Your comments
Mike,
What is your thinking on this topic?
The status of this upgrade was changed to "Planned" 4 months ago. Would you please provide an update on the progress?
Brian's suggestion is spot on. Here are just two admittedly cherry-picked examples:
Hess Corp (HES)
Current Price: $57.22
Median Fair Value: -$66.6 (minimum price for any stock is $0.00)
Action Score: D
Deutsche Bank (DB)
Current Price: $8.78
Median Fair Value: $53.35
Action Score: F
Nobody thinks DB is worth anywhere close to $53.35 per share.
If is worth much higher than current price, then an F Action Score is nonsensical.
There are many, many more similar examples.
In a basic sense, the Action Score methodology works for most sectors, but not for Energy, Finance, Materials, Real Estate, and Utilities sectors. So, there are myriad examples in these sectors where the purported Action Scores are, in reality, simply erroneous and misleading. It should be incumbent on OSV to provide an Action Score methodology that is a rational approach for every company for which an Action Score is published. As it stands now, both the Action Scores and Fair Values are substantially misleading for a significant percentage of companies.
Like Brian, if OSV is willing to commit to improving this situation, I would be "happy to provide more specific ideas and details" to work with and provide feedback to whoever would be making these needed changes.
Jeff
- Re long term debt change from balance sheet -- got it.
- Re use of 'Help and Support' -- will do.
Thank you.
Yes, now corrected. Thank you.
Can you also look at 'Change in Long Term Debt, 3 Year Growth' and related criteria?
Just noticed it yesterday when I wanted to add it to one of my screeners.
Another criteria in error just identified:
- Change in Long Term Debt, 3 Year Growth (I didn't check, but suspect other similar 'Change' criteria should also be checked and corrected if necessary).
Would you like me to continue to identify other criteria in error when discovered. There are others that I tried to add to my screeners in the past that were in error, so I deleted those from my screeners -- but didn't report them.
Thank you Mike. Your presence now at OSV and responsiveness is a very welcomed improvement.
Many have generic descriptions. Please look at all under Key Stats/Key Ratios.
Look at my post from 2 years ago (same discrepancies apply). For example, P/CF says "price per share divided by cash flow per share", which is a formula -- but begs the question: what is formula for 'cash flow'. Same idea for ROIC -- what is the formula used?
Please provide more detailed formulas for everything listed in Key Stats/Key Ratios list.
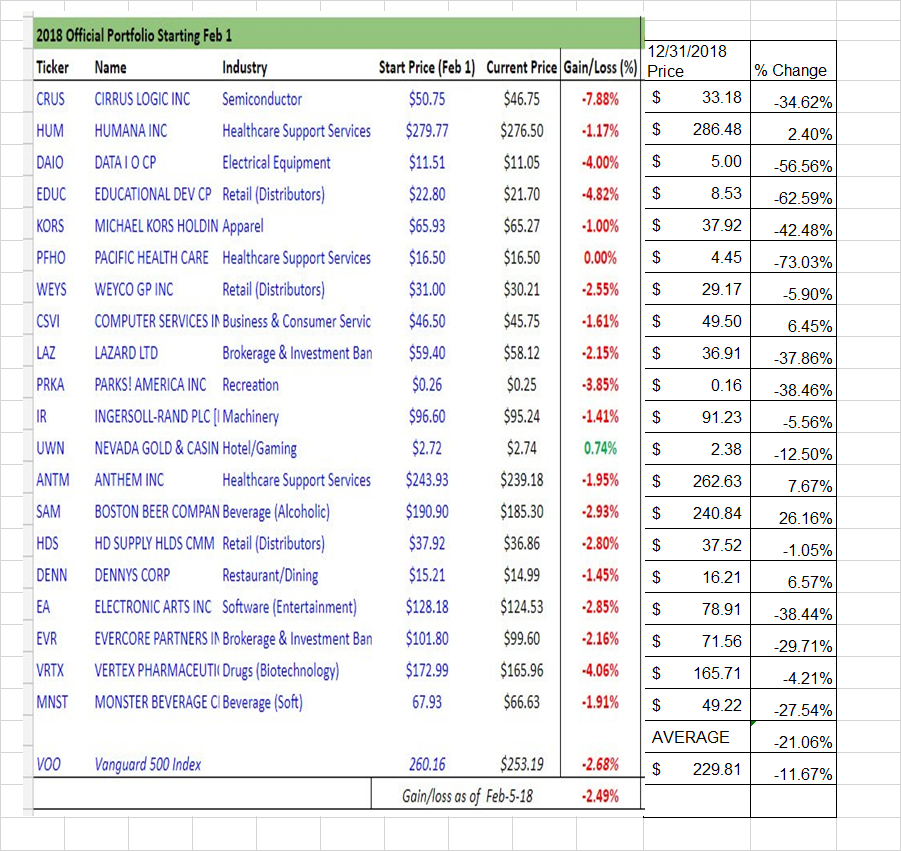
Unfortunately, the OSV 2018 Portfolio SUBSTANTIALLY UNDERPERFORMED the Vanguard 500 Index in 2018:
Customer support service by UserEcho


Once again (from my previous comment):
In a basic sense, the Action Score methodology works for most sectors, but not for Energy, Finance, Materials, Real Estate, and Utilities sectors. So, there are myriad examples in these sectors where the purported Action Scores are, in reality, simply erroneous and misleading. It should be incumbent on OSV to provide an Action Score methodology that is a rational approach for every company for which an Action Score is published. As it stands now, both the Action Scores and Fair Values are substantially misleading for a significant percentage of companies.
Like Brian, if OSV is willing to commit to improving this situation, I would be "happy to provide more specific ideas and details" to work with and provide feedback to whoever would be making these needed changes.
Bottom line: this improvement to OSV needs to be PRIORITY #1 for OSV and addressed immediately!
Jeff