How to Analyze Texas Instruments
Summary
- A fundamental look at how Texas Instruments is a Quality & Growth investment at a fair price.
- Growth in their top segment of industrials and automotive is key to their long term business.
- Valuation using 4 different angles has the average fair value at around $126 with the lower end being $100 and upper end being $160.
One category of stocks that have been doing particularly well in my portfolio has been stocks I’ve classified as Quality and Growth.
My favorites are actually the ones that check the boxes for Quality, Value AND Growth, but with typical value stocks unable to receive any attention like the middle child, the sub category of Quality and Growth have taken over.
This is not to say that these Q&G stocks ignore value.
So what is considered Quality and Growth?
The Quality Conditions
For quality, I look for the following:
- FCF/S – Free Cash Flow to Sales: Looks at the percentage of sales a company is able to convert to FCF.
- CROIC – Cash Return on Invested Capital: Similar to ROIC but uses cash as a metric to determine how effective management has been in making use of invested capital.
- Piotroski Score – A 9 point fundamental scoring system to look for only sound stocks.
The Growth Conditions
The way I define growth is slightly different. In the last article I wrote, I used the following chart by Morgan Stanley and looked up 3 companies growing sales that have and are leading to long term returns.
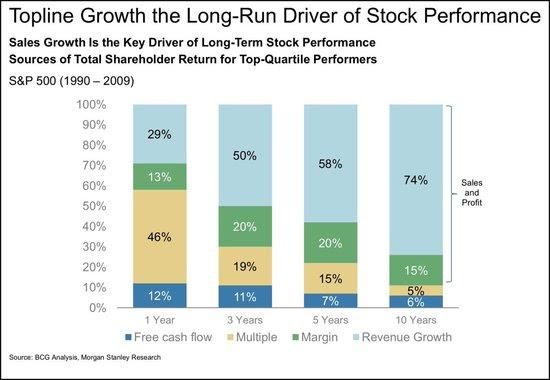
source: BCG Analysis, Morgan Stanley Research
Growth is also important at a profit level. Sales is great, but in the long run, I want to invest in companies that will turn sales into profit so that it doesn’t burn into the ground. The growth that I focus is on the growth in profitability.
Not just topline sales or EPS growth.
Here’s what I categorize as my growth conditions.
- Sales % Change TTM: Looking for companies with sales increase over the TTM.
- Sales 5 Yr CAGR%: Looking for companies with 5 year track record of increasing sales.
- GPA – Gross Profit to Assets: Measures the growth of profitability. Answers the question, are the assets profitable? A GPA of 0.5 means the company is generating profits of $0.50 for every dollar of assets. The higher the ratio, the more profit is being extracted off every dollar of assets. This ratio is a great way to quickly compare competitors within the same industry.
The Munger Stocks
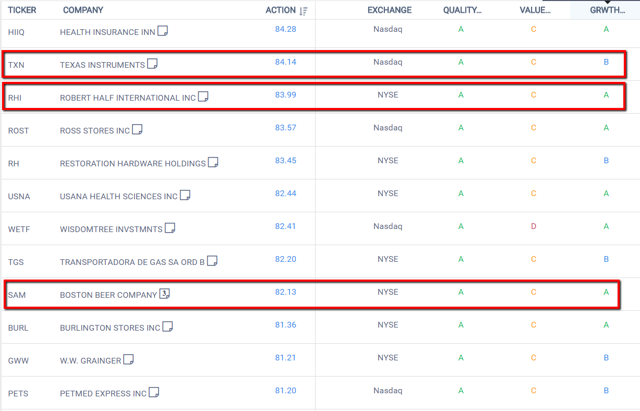
I call the stocks that fall into my predetermined range for the above conditions, “Munger Stocks”, after Charlie Munger. Idea is to buy quality companies with growth potential at a fair price. The screen details can be viewed publicly from this link to the screener.
The stocks that I’m interested in are highlighted below, but for today, I’ll be focusing on Texas Instruments.
Texas Instruments (TXN) is a Munger Stock
When I hear Texas Instruments, it reminds me of calculators. But the company produces a rich and diverse portfolio of analog and embedded processing products.
The analog segment products convert real-world signals like sound, speed and temperature into digital data and products are things like amplifiers to processors and switches which go into all sorts of applications. However, their main focus is on the industrial and automotive markets which offer longer product life cycles, where they are doing much better than supplying to the mobile phone or personal electronics industry where life cycles are very short, demands are constantly increasing and required capex is expensive.
What I like about Texas Instruments is that management focuses on Free Cash Flow. If you read their reports, they make it priority. Their FY 2017 annual report mentions “free cash flow” 18 times, compared to 0 for EBITDA.
The common thread for being bullish on Texas Instruments is how well positioned the company is for the automotive industry. Cars are becoming increasingly complex with the driving assistance systems, parking assistance, high tech infotainment systems to control everything in the car, 21 positioning power seats, body sensors, and of course, the move towards EV powertrains.
With the automotive segment making up 19% of revenue in 2017, it’s not a surprise that there is more room to grow. Just a few years ago in 2014, Automotive segment made up 13% of revenue.
While the talk of the car industry is exciting, don’t forget the boring industrial market which made up 35% of revenue last year. In 2014, the industrial market made up 31%.
Quality Metrics That Put Texas Instruments On the List
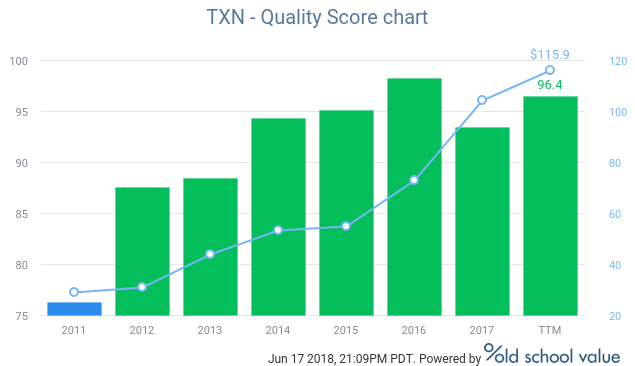
Since 2011, their quality score has steadily increased. I’m not surprised looking at the following numbers.
- FCF/S TTM: 32.1% – converts $0.32 of every $1 into FCF. My preference is to look for companies above 15%, and TXN is doing double that. This is an extraordinarily profitable and well run company. Maybe Tesla should consider buying them out to make their production easier and cheaper?
- CROIC TTM: 33.4% – just as impressive where anything over 30% is a clear indication of a very strong competitive advantage. If you look at their financials closer, it’s not surprising to see how CROIC is so high. Here’s a chart of their net income growth.
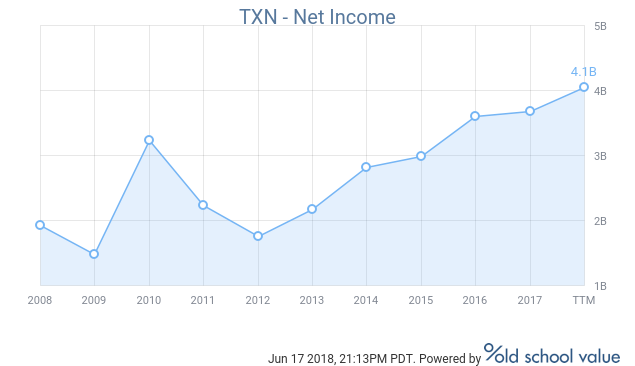
The company has more than doubled net income since 2012 giving it plenty of opportunities to reinvest and take advantage of growing markets.
- Piotroski Score TTM: 8 – solid fundamentals and all round numbers. Won’t lose sleep owning this company.
Growth Potential Is Strong
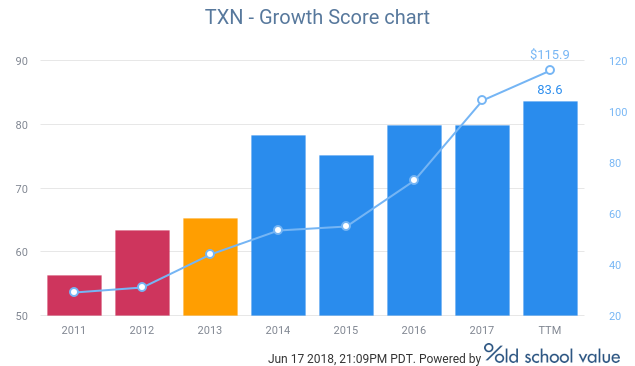
Another good sign is to see the growth score increasing. In 2011 and 2012, not much growth was there until things really started to pick up in 2014.
- Sales % Change TTM: 11.5% – sales over recent periods outpaces what it has done historically. Industrial and automotive are the two strong tailwinds for this as other segments like Personal Electronics, Communications Equipment and other areas are down. If TXN can reduce the decline in personal electronics, it will make things even brighter, but competition in industries like tablets, computers, printers, TV and home theaters is cut throat with lower margins.
- Sales 5 Yr TTM CAGR %: 3.7% – From 5 years ago, growth CAGR isn’t much, but it makes the recent performances and expected growth something to be excited about.
- Gross Profit to Assets: 0.57 – this is best compared to competitors to see how profitable the company is. The side by side comparison has Texas Instruments way above the competition in gross profitability. The 5 year sales growth is slower than the competitors, but without profitability, growth is hard to sustain for the long term.
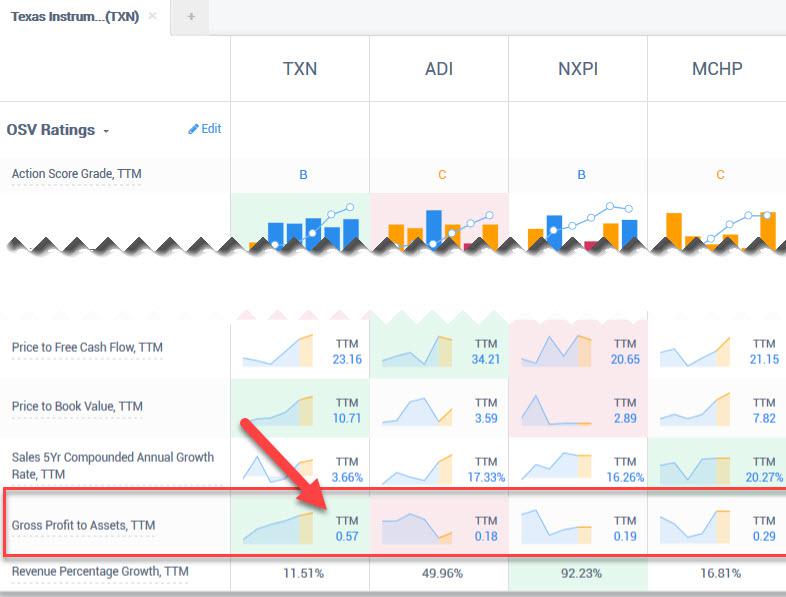
TXN has a GPA of 0.57 which means, the company generates $0.57 of gross profit off every dollar of asset it owns. Big win over competitors.
What’s Texas Instruments Worth?
One thing I’m not shy about is saying that I don’t have any sort of edge on a company like Texas Instruments. The company is not difficult to understand, there are 30 Wall Street analysts following the company with institutions owning 86% of the company.
The only way for retail investors to make money is to not overpay. Get in at a price where the stock is trading below intrinsic value, or where the company will grow into its valuation.
FCF is the name of the game and over the past 3 years, the FCF CAGR has been a little under 10%. My assumption here is that it will grow quicker than this based on the growing demand in their operating industrial and automotive segments.
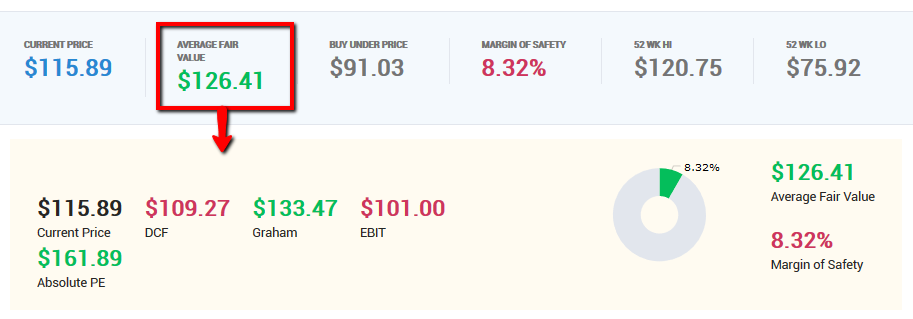
- FCF based DCF: $109 – multi-stage DCF
- Graham Formula using EPS: $133 – upper range using EPS valuation
- EBIT multiple valuation: $101 – income statement based valuation
- Absolute PE based valuation: $161 – upper range valuation by adjusting the PE based on the fundamentals
Here’s the link to the methodology of each stock valuation method as it is too long to provide here.
The intrinsic value range is from $100 to $160 with the average being $126. This is a base case scenario where it’s mostly business as usual without factoring in too much growth.
With the current price at $115, it’s still below the average fair value considering this is a company that checks the box for quality and growth.
Looks like a fair price for a great company at the moment.
Summary
- Texas Instruments offers quality and growth at a fair price.
- Growth in their top segment of industrials and automotive is key to their long term business.
- Valuation using 4 different angles has the average fair value at around $126 with the lower end being $100 and upper end being $160.
Customer support service by UserEcho
