Example of Setting Up New Screen Ideas
What You’ll Learn
- Sales growth is a key driver of long term stock performance.
- How to screen stocks for sales growth and profit.
- LOW, NVDA, ADBE are 3 stocks that meet the sales and profit criteria with a look at how it’s been achieved.
This is the chart that got my interest and the idea behind finding the 3 stocks for this article.
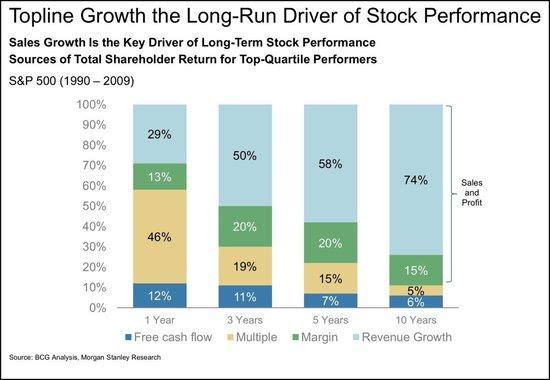
source: BCG Analysis, Morgan Stanley Research
While the time period of 1990-2009 is not recent, the idea is interesting.
The chart compares the stock performance based on 4 different drivers comparing the stock returns of top quartile performers over different time periods.
- Free cash flow
- Multiples
- Margin
- Revenue Growth
If holding for less than 1 year is your style, then focusing on multiples looks to be winner. However, my preference is to take note of the 5 and 10 year columns.
As a big follower and practitioner of free cash flow, it’s surprising to see that a small percentage of shareholder returns is a result of free cash flow over a longer time period. But what the chart does not show is the context in which FCF is used.
FCF as a metric is best used by investors to determine how healthy a company is. Not how much it can hoard. The companies that operate with big FCF margins are able to reinvest it into R&D and other avenues to further drive sales and profit. I like FCF to the foundation of sales and profit.
But sales and profit is flashier than FCF, and the market rewards that.
Seeing how FCF is not the focus of this chart, I’m going to go along with the ride and share 3 companies that have increased sales and profit nicely over 5 years.
The Screen Set Up
Here’s how I’m looking to find these outperforming stocks.
I’ve named this screen “Sales and Profit Seeker” with criteria of
- Sales 5YR CAGR between 30-300% as I’m looking for companies that have experienced a decent jump in sales.
- Gross Profit 5YR CAGR between 0-100% for profitable companies.
- Gross Profit to Assets (GPA) between 0.3 and 1.5. GPA is a measure of how much profit a company can extract from its asset base. The higher, the more efficient and profitable.
- FCF 5YR CAGR > 0%. I know, I know. I didn’t want to put it in, but it will help weed out companies that lose money or haven’t been able to reinvest.
- No OTC stocks for this experiment.
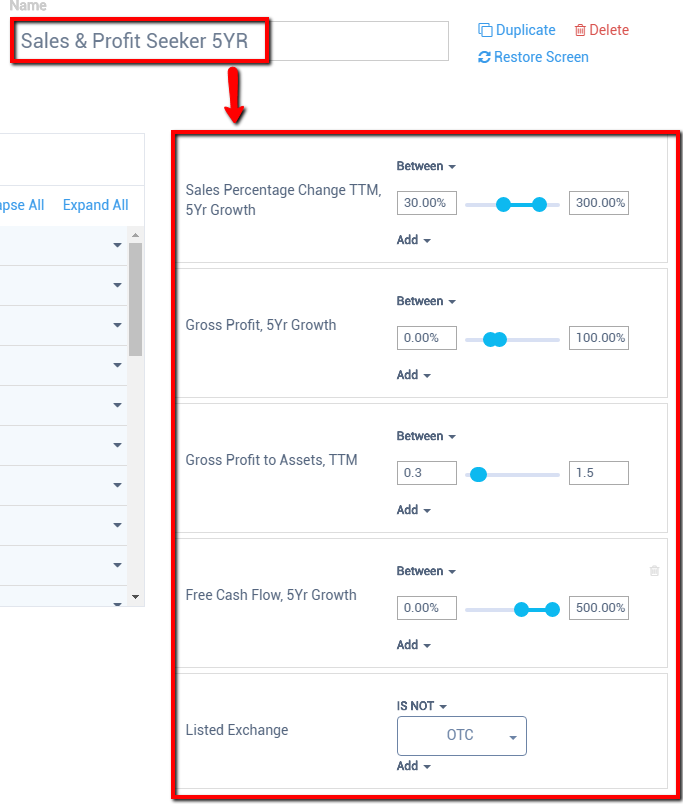
source: Old School Value Stock Screener
Sales & Profit Seeker #1: Lowe’s (LOW)
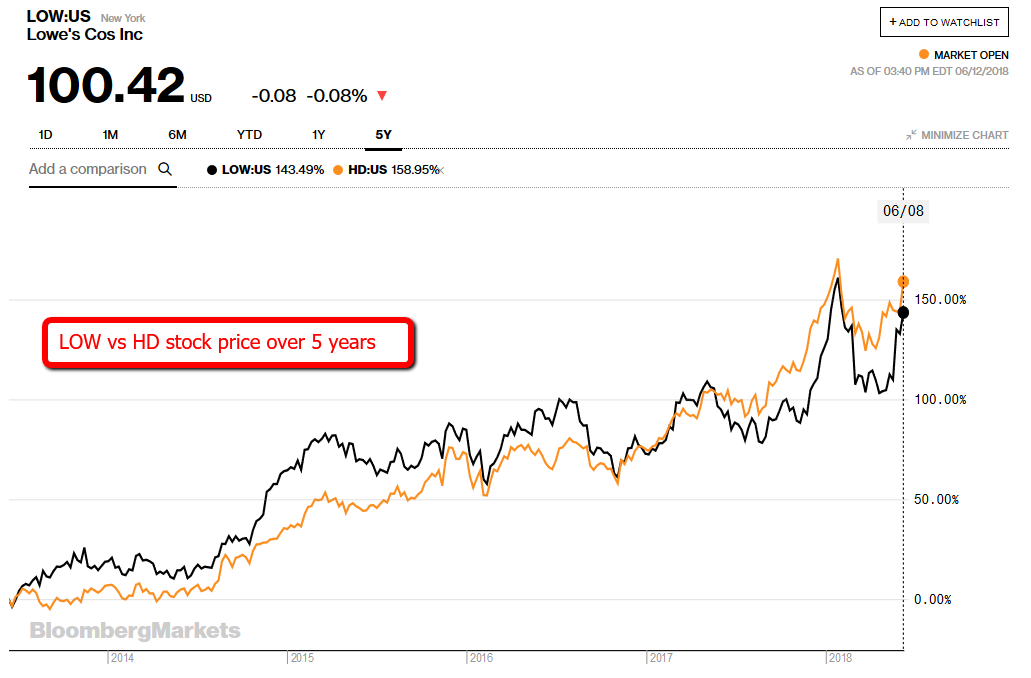 source: Bloomberg
Home Depot (HD) is slightly higher than Lowe’s, but with the way Lowe’s is churning out sales and profit, there’s potential for greater long term returns.
Lowe’s shows up on the screen with the following numbers:
- Sales 5YR CAGR of 54.8%
- Gross Profit 5YR CAGR of 6.2%
- GPA of 0.62
- FCF 5YR CAGR of 9.1%
For such a large company, these are great numbers. As a side note, Home Depot did not make the list.
With the way the housing prices have continued to go up and more people are replacing appliances or upgrading their homes, Lowe’s and Home Depot hit the sweet spot in this economy.
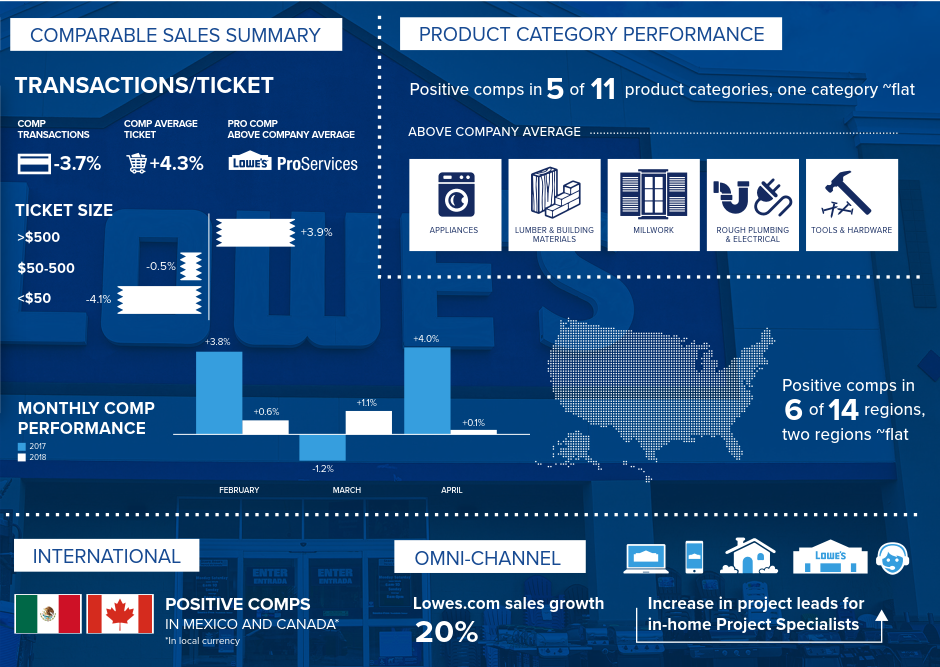
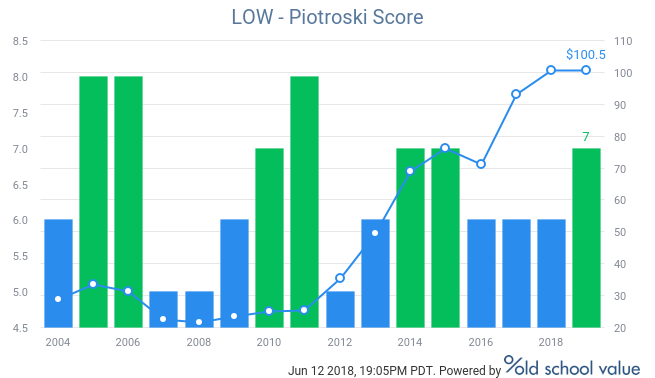
source: Lowe’s Investor PresentationLowe’s is not a fast growth company, but combined with consistent fundamentals and quality checks, it’s a company that looks to continue its long term returns to shareholders.
In the image below, the Piotroski score averages a score of 6 or 7 with the rise in stock price starting in 2012.
Sales & Profit Seeker #2: Nvidia (NVDA)
Nvidia’s growth has been and is astounding.
It’s firing on every level.
Over a 5 year period, the growth in gaming, data centers, automobile and even the weakest segment of professional visualization has launched Nvidia into one of the fastest growing companies.
Many people think Nvidia’s growth is a result of crypto currency mining, but not so. It brings in nice revenue, but it is a single digit percentage in total sales. The majority comes through gaming and data centers and the growth expected from these two segments doesn’t seem to be slowing down.
Datacenters are cyclical, but with the way the tech industry is evolving at a rapid pace, bigger need for better graphics, improved software development processes and non-stop consumption of digital media, and it all has to come from somewhere. Software from companies like Adobe (ADBE) and hardware from companies like Nvidia all benefit from the changing industry landscape.
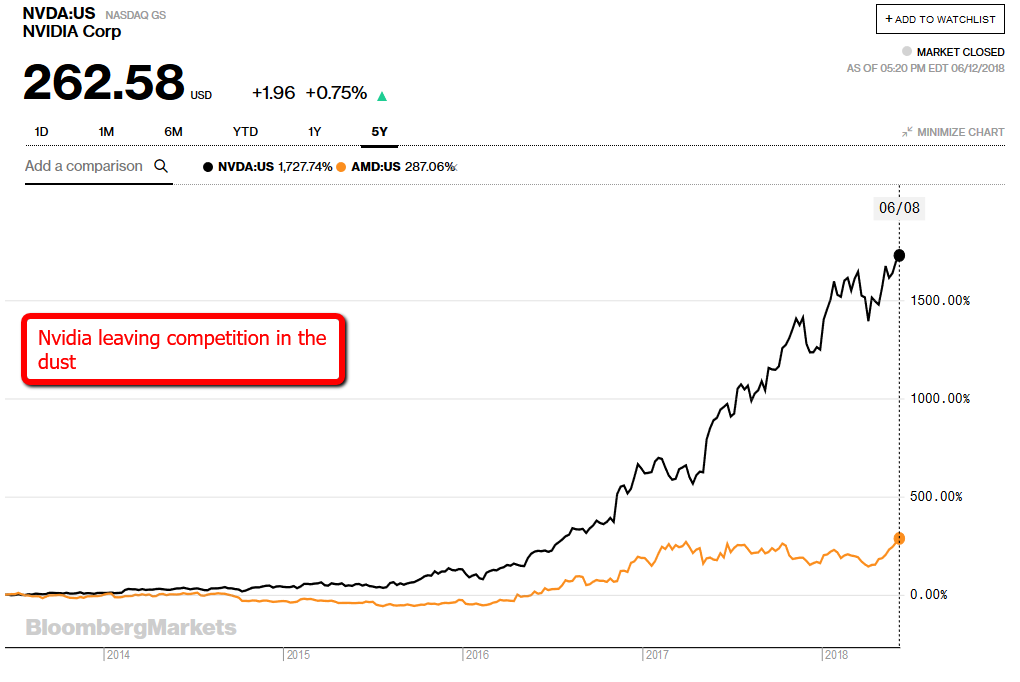
Stock prices don’t give much information, but when you look at AMD and Nvidia side by side, you can tell Nvidia is doing something different.
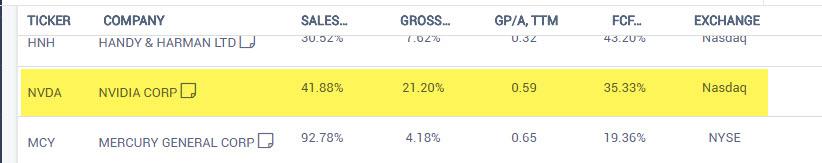
So how did Nvidia get on this list in the first place?
- Sales 5YR CAGR of 41.88%
- Gross Profit 5YR CAGR of 21.2%
- GPA of 0.59
- FCF 5YR CAGR of 19.36%
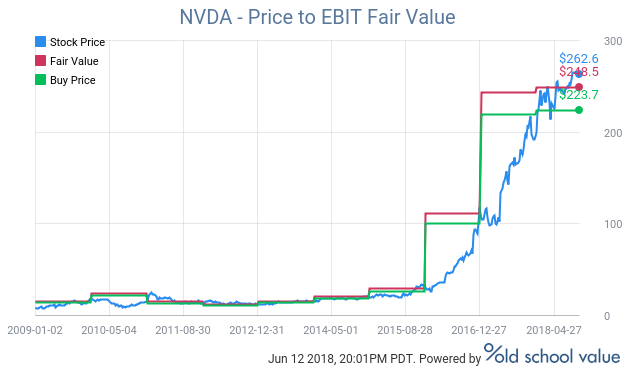
Backwards looking valuation methods do not work on Nvidia. As much as I’m a fan of FCF, I won’t bother trying to run my 10year DCF model here.
Multiples also look expensive on the surface, but Nvidia is proving like Amazon that it is growing into their current “expensive” numbers.
In this valuation using 3 years EBIT multiple average, Nvidia is doing just that. It’s growing into its valuation.
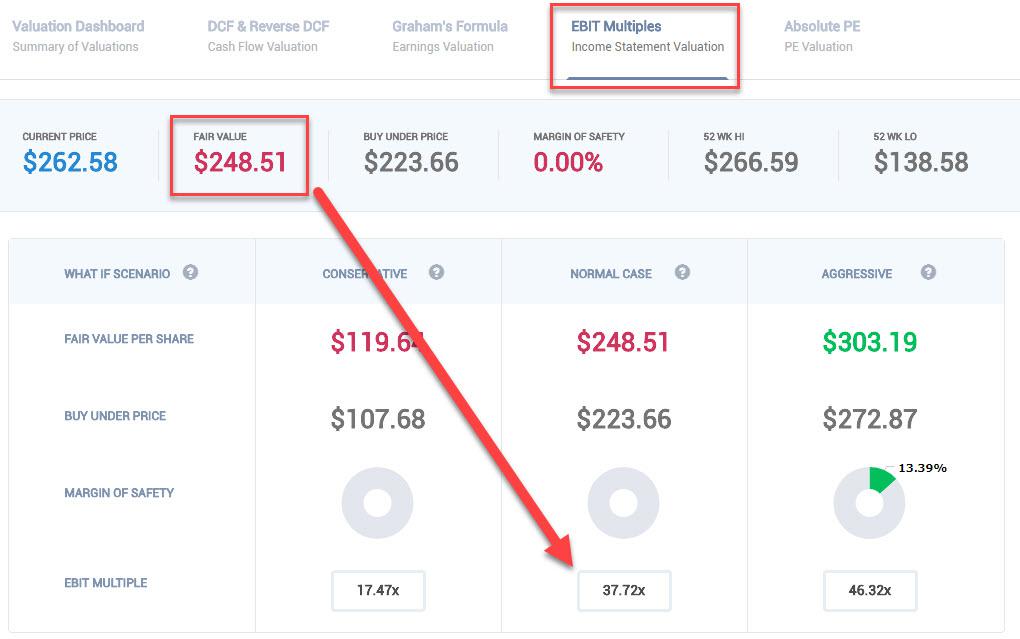
Yes a company with a typical EBIT multiple of 37x is absurd. But if the company is seeing strong sales and profit and the fundamentals are matching it stride for stride, there’s no problem with that.
I own Nvidia based on my quant strategy bucket. Based on the ratings that we’ve created at Old School Value, it scores highly with a slight ding for valuation. The Action Score of 78/100 puts it in a solid B grade category overall when we measure Quality, Value and Growth combined.
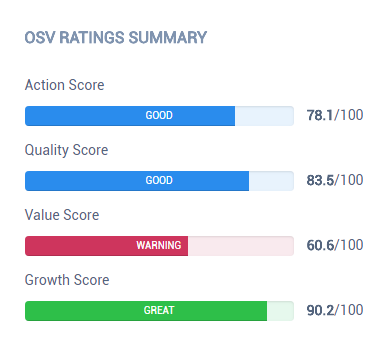
Let me be clear. At current prices, I would not make Nvidia into a 10% position. Now onto #3.
Sales & Profit Seeker #3: Adobe (ADBE)
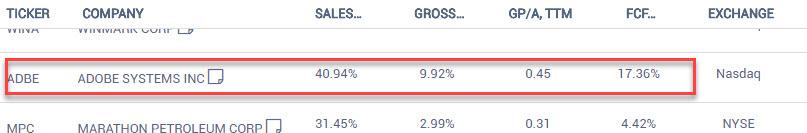
- Sales 5YR CAGR of 40.9%
- Gross Profit 5YR CAGR of 9.9%
- GPA of 0.45
- FCF 5YR CAGR of 17.36%
Adobe is an impressive software company. Software is great because of the massive margins, no inventory, little real estate required and being able to entrench yourself once your userbase is used to your system.
Adobe’s conversion to a SaaS business model and growth with Creative Cloud is reaping huge rewards – sales + profit.
Adobe is the dominant software used by mostly any artist, pro, advanced user, photographer, videographer, writers and more. There are hundreds of thousands of tutorials and videos on using Adobe software, millions of content produced with Adobe, and billions of people have seen the output without knowing it was created with Adobe software.
Businesses dream of having an ARR like this chart. The beauty of SaaS is that the projections are much easier and smoother to predict.
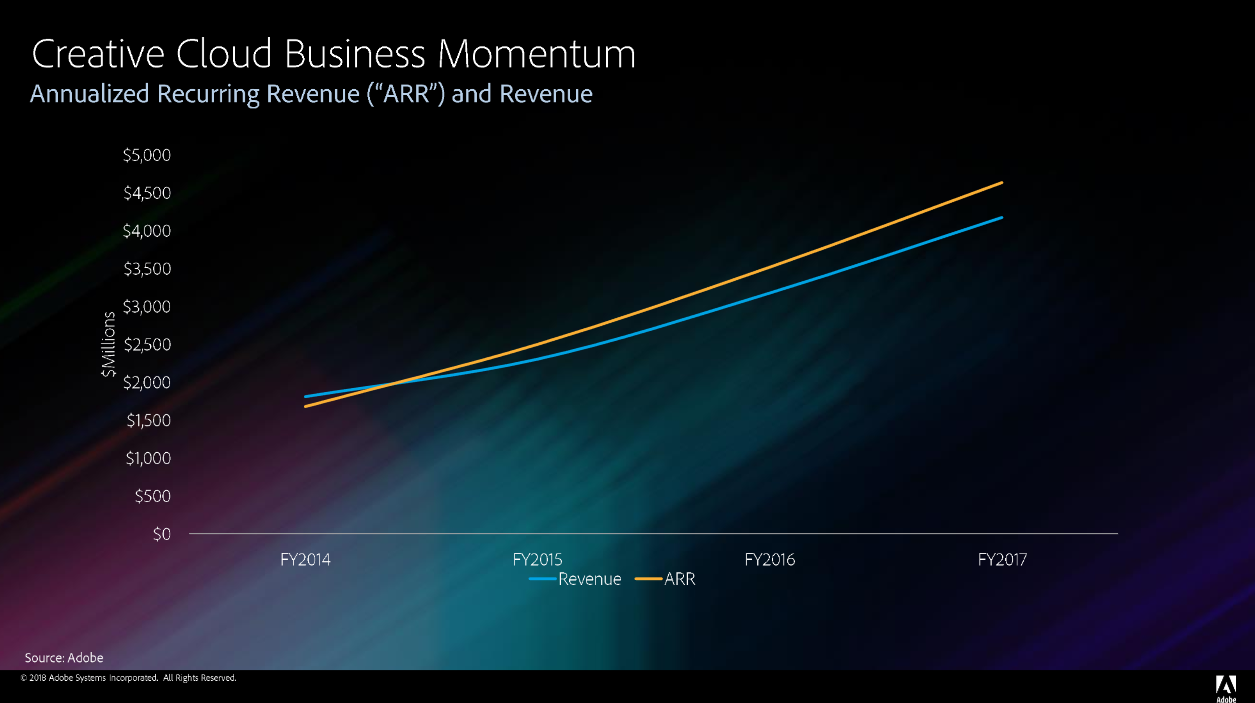
Source: Adobe investor presentation
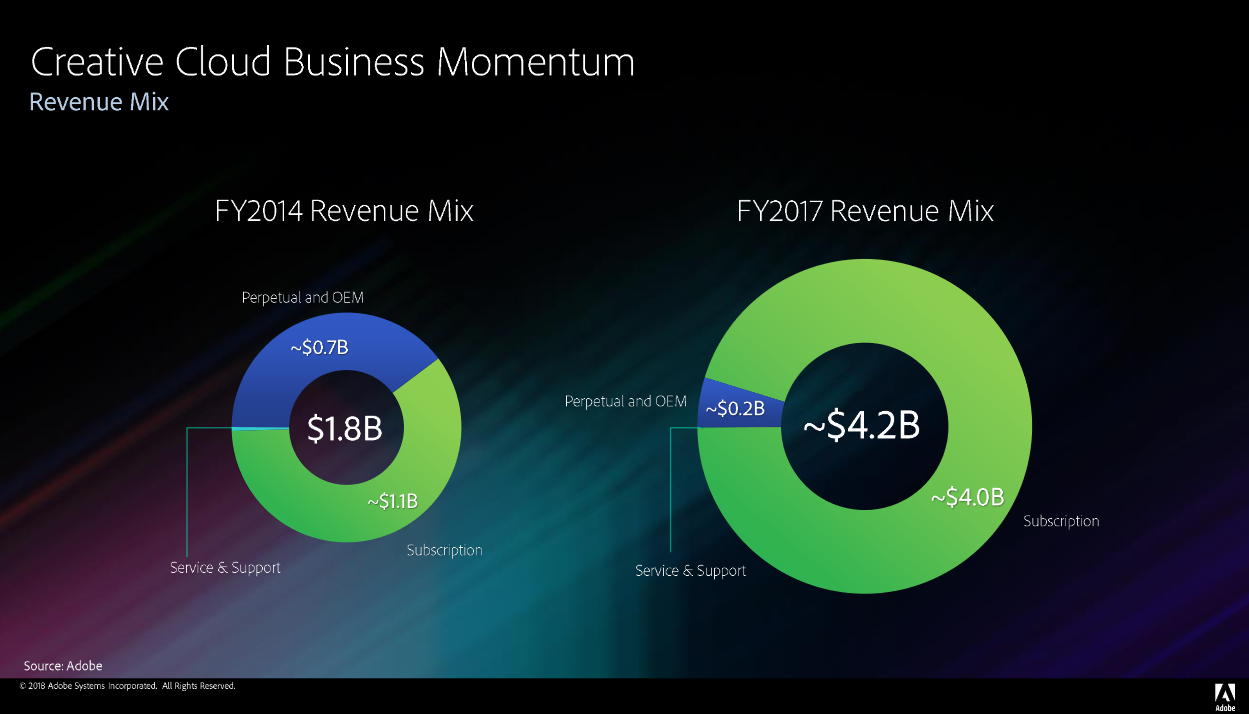
The story of Adobe’s growth has really come from the successful transition to SaaS. You can see the huge difference between the 2014 and 2017 numbers. In 5-10 years time, it’s not hard to see the number getting bigger and
Adobe coming up with new subscriptions to address holes in the market.
Their recent acquisition of Magento is just one example. Seeing how Shopify (SHOP) is dominating the ecommerce space, I wouldn’t be too surprised if Adobe is trying to put their fingerprints on the industry somehow.
Summary
- When coming across interesting charts or graphs, try to find stocks that match the criteria.
- Sales growth is a key driver of long term performance
- LOW, NVDA, ADBE are 3 stocks that meet the sales and profit criteria. They have all run up, but in 5-10 years, they could be higher as their business continues to improve.
Disclosure
Long NVDA.
Customer support service by UserEcho
