How to Value Facebook
What You’ll Learn
- News about Cambridge Analytica is non-material to FB as an investment.
- 2 fundamental indicators showing just how strong FB is.
- A look at the different valuation methods used to show whether FB is a buy or not.
Yes or no.
Will Facebook (FB) face permanent fundamental damage based on its current Cambridge Analytica news?
My verdict? No.
Like most things, the media is blowing this out of proportion for the sake of clicks and views. The sole purpose of a media outlet is to attract eyeballs, and as they do so often, they jump from one “news” band wagon to another. Facebook just happens to be the punching bag of the day.
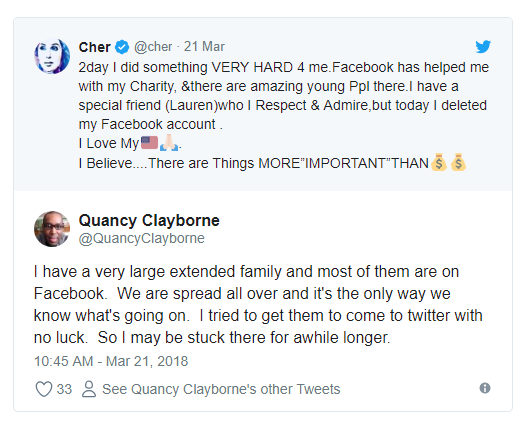
Here’s a piece from the NYT making it sound like users are leaving Facebook in droves.
Let’s assume that 60,000 people deleted their profiles like Cher.
No, wait.
I’ll call and raise it to 1,000,000 deleted their account.
Of the 1M users, this obviously includes deactivated accounts and those that were dormant to being with. People with these accounts will be the easiest to delete. If I take a very bad guess and say 20% of these accounts were idle, that means 800,000 active accounts were deleted.
Huge number right?
Here are some facts to put this into perspective thanks to Zephoria and the 10-K.
- Worldwide, there are over 2.13 billion monthly active Facebook users for Q4 2017 (Facebook MAUs) which is a 14 percent increase year over year.
- There are 1.15 billion mobile daily active users (Mobile DAU) for December 2016, an increase of 23 percent year-over-year.
- 1.40 billion people on average log onto Facebook daily and are considered daily active users (Facebook DAU) for December 2017, which represents a 14 percent increase year over year
With 2.13B active Facebook users, 800k deleted accounts equates to 0.04% of total accounts deleted.
Facebook’s Moat
Even with the company headlining the news, here’s a legitimate reason why people are not leaving Facebook.
Facebook’s moat is too strong.
There are other social networks and apps, but people mainly use a few social networks at most.
Facebook also happens to be the social network that connects with a diverse age group, making it possible for large families to connect and stay in touch.
If a network effect is too weak, here’s a different angle.
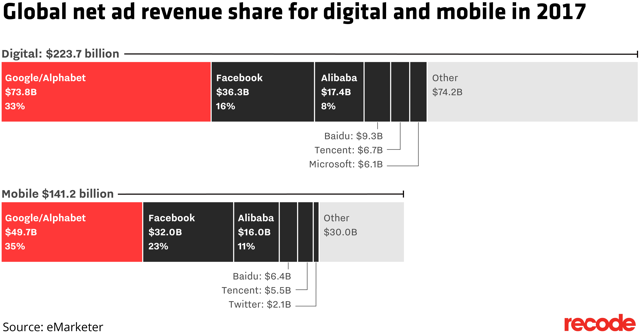
Source eMarketer
Globally there are 2 main players – Google (GOOGL) (NASDAQ:GOOGL) and Facebook dominate with 49% market share.
Mobile is even stronger with Google and Facebook eating 58% of the market share.
The trend is going strong in terms of ad revenue as marketers choose either Google or Facebook as the platform. Amazon advertising is a dark horse as they continue to broaden their advertising reach (ads are only available for sellers).
Market Expectations
With the Cambridge Analytica news, Facebook’s stock was affected.
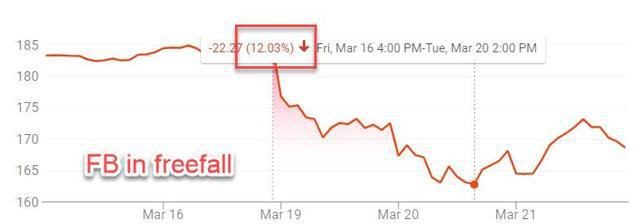
Source: Google Finance
From the peak to the trough, it was a drop of 12%. Zoom out some more and we all know what Facebook has done.
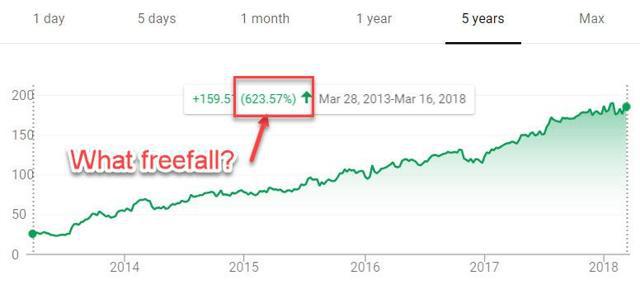
Source: Google Finance
There have been bigger drops in the past.
Is Facebook A Buy?
Too bad Facebook did not drop 30% on the news. That would have made it newsworthy, but -6.63% on the year is nothing to get excited about when it returned 51% in 2017.
But I’m still optimistic about Facebook because the numbers tell a very different story to the news.
Unless the numbers are cooked, numbers do not offer opinions. It tells it like it is. Here’s the real news based on the numbers.
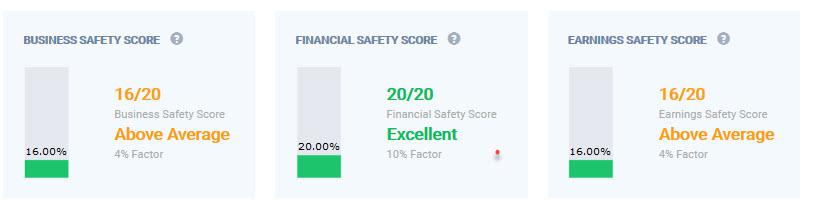
Fundamental Strength
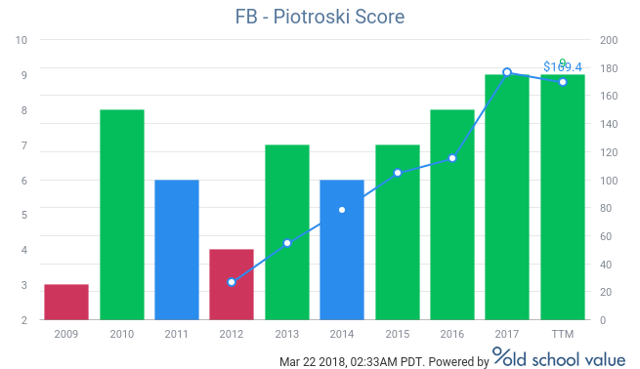
Facebook has a perfect Piotroski score. The Piotroski score is a fundamentals based scoring system that looks at the following.
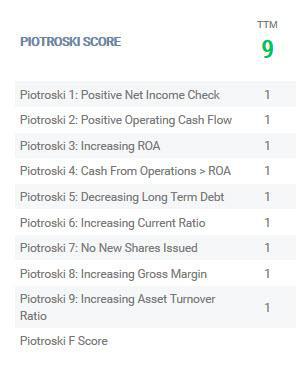
Based on the results of the 10-K, Facebook has now achieved top grades.
Companies will make mistakes. The weak die from the negative spotlight, while the strong bounce back and get stronger than before. Don’t be surprised if Facebook is the later.
I also like to look at the DuPont Analysis to get the true reading of the company’s ROE.
Facebook’s ROE has been accelerating over the past 5 years which makes it easier to fund operations and invest in new areas to continue growth.
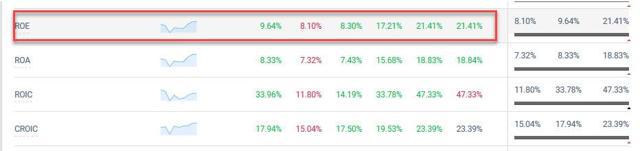
But rather than just take ROE at face value, breaking down ROE into separate components is the best way to truly understand how the company is increasing ROE.
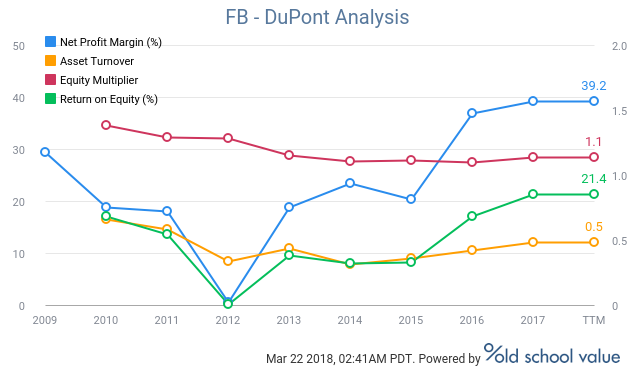
In Facebook’s case, ROE is increasing as a result of margin expansion. This is the perfect example of how a company should grow.
Fundamentally, it’s as solid as a rock.
Is Facebook a Buy at Current Prices?
YTD -6.6% return isn’t what I consider a discount after returning over 600% in 5 years, and it’s taken me a while to buy into Facebook, but the valuation is still compelling for a long term play.
The values below are not 1 week or 1 month targets. It’s a long range shot.
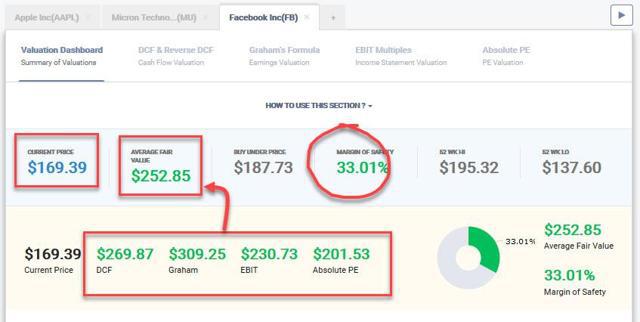
I like to use different valuation tools to get a wide perspective of what the potential intrinsic value could be. Using a total of 4 valuation methods, the average fair value comes out to $252 versus today’s price of $169.
The total value range is from $200 to $310, with my low estimates still higher than the current price.
- Multi stage DCF: $270 fair value target with main inputs being a $15.9B DCF start value, 25% growth rate, 8.4% discount rate.
- Graham’s Formula: $310 fair value target using 25% growth rate, $7.27 eps
- EBIT Multiples model: $230 fair value target using normalized EV/EBIT multiple of 24x
- Absolute PE model: $200 fair value target using an adjusted PE of 37 based on above average fundamental factors.
Market Expectations
My calculations can easily be wrong. To see how wrong I can be, an easy test I run is to compare my growth estimates with what the market is expecting from the current stock price by doing reverse valuations.
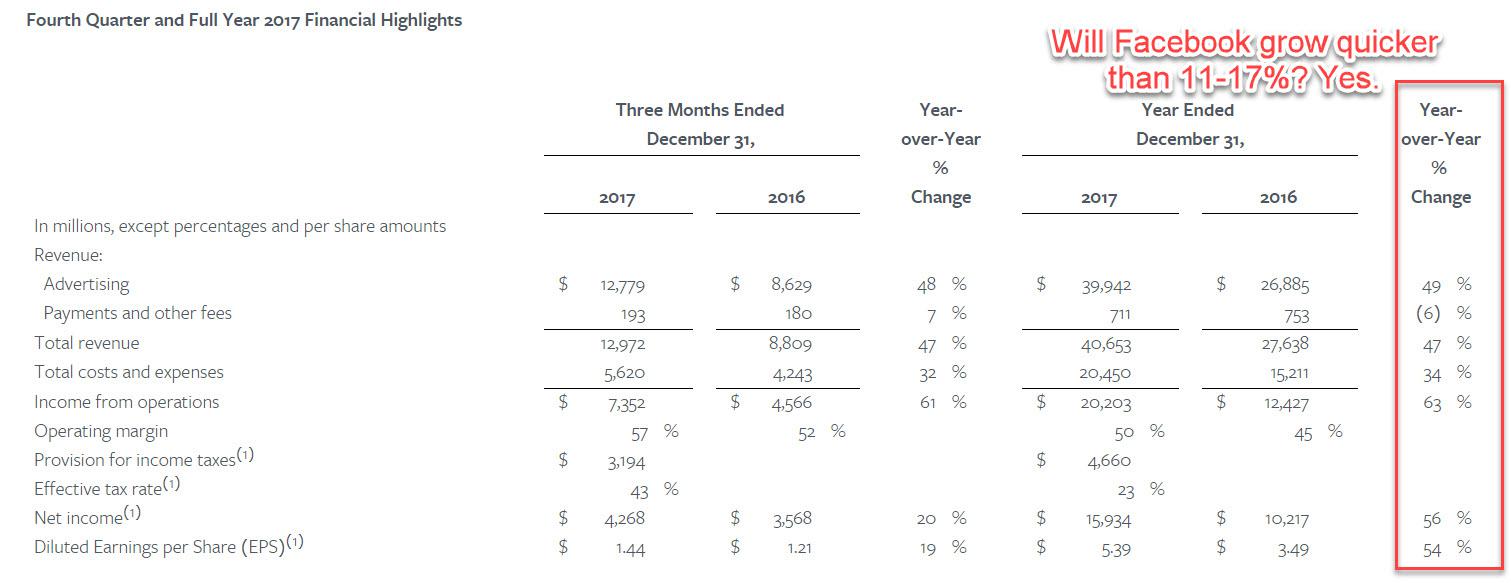
Doing a reverse DCF shows that the market is expecting 17% growth from Facebook. In other words, if you believe Facebook can grow faster than 17%, the stock is cheap.
A reverse Graham formula using EPS estimates, shows the market is expecting 11.6% based on the $170 price tag. Can Facebook grow EPS faster than 11.6%? If so, it’s cheap.
These are only top line numbers, but I have a feeling that Facebook can grow faster than 11-17%.
Extra Data
- Use the Old School Value app for free with FB – type FB into the search bar
- Screenshot of Facebook valuation multiples and data points
- Facebook Summary PDF
Disclosure: Long FB.
Customer support service by UserEcho
