[OSV Tutorial] Careful! Here's how to stay far away from value traps
(Ratings are past examples to help explain the concepts. The app has the latest data.)
What you'll learn:
- Tips for the Active Investors to weed out potential value traps
- The benefits of combining the Action Score + value chart
- how the Action Score works
- gotten used to the rhythm of using OSV Online
- getting better at identifying the Action Sore combinations
But if you like to get your hands dirty, you can weed out potential value traps even further.
Let's look at Tata Motors (TTM) as a past example.
It's an Indian based car company.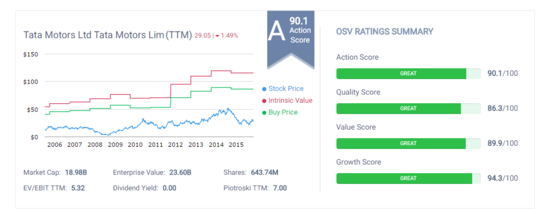
Fair value chart shows that it is undervalued. It gets an A on the Action Score.
A no brainer investment right?
Not so fast.
Consider this when looking at the OSV Ratings / Action Scores.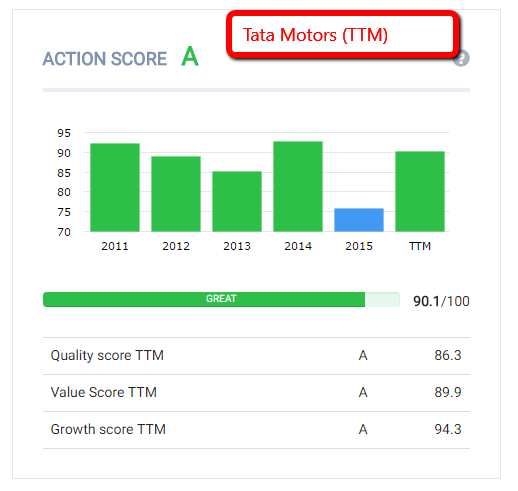
The Action Score rating is consistently in the A grade. In 2015, it dipped to a B/C, but came back to an A in the TTM.
Here's the message I get.
If a stock is a perennial A grade stock, it's a potential value trap.
For some reason, value isn't being recognized.
- Maybe it's because TTM is an ADR and based in India.
- Maybe Indian economics don't support a car company well.
- Maybe the market doesn't see much opportunity for TTM to grow without continually having to acquire other car companies or brands.
Here's the second example: Qualcomm (QCOM). These are past scores. Check OSV Online for the latest.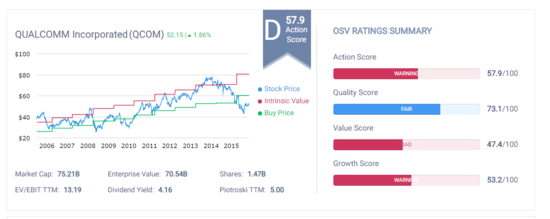
Fair value chart shows that the stock is cheap. But wait. It has an Action score of D.
Looking closer, it has a Piotroski score of 5.
Its historical average is 6 or 7 but things haven't been going so well - as evidenced by the drop in stock price.
When you dig into the numbers, it's not "horrible".
But there are thousands of stocks in the market, that score and rank better with better fundamentals.
Will you choose to spend time and money on your 3rd or 4th best idea? Or look for the best ones possible?
The intrinsic value chart is based on a DCF, and we'll get to making adjustments to the valuations next time.
But when you combine the Action Score with the fair value chart, it gives you a second opinion.
We all need second opinions. Especially when we are investing thousands of dollars.
Customer support service by UserEcho
