
 I am wondering you could use Log scale to plot the chart.
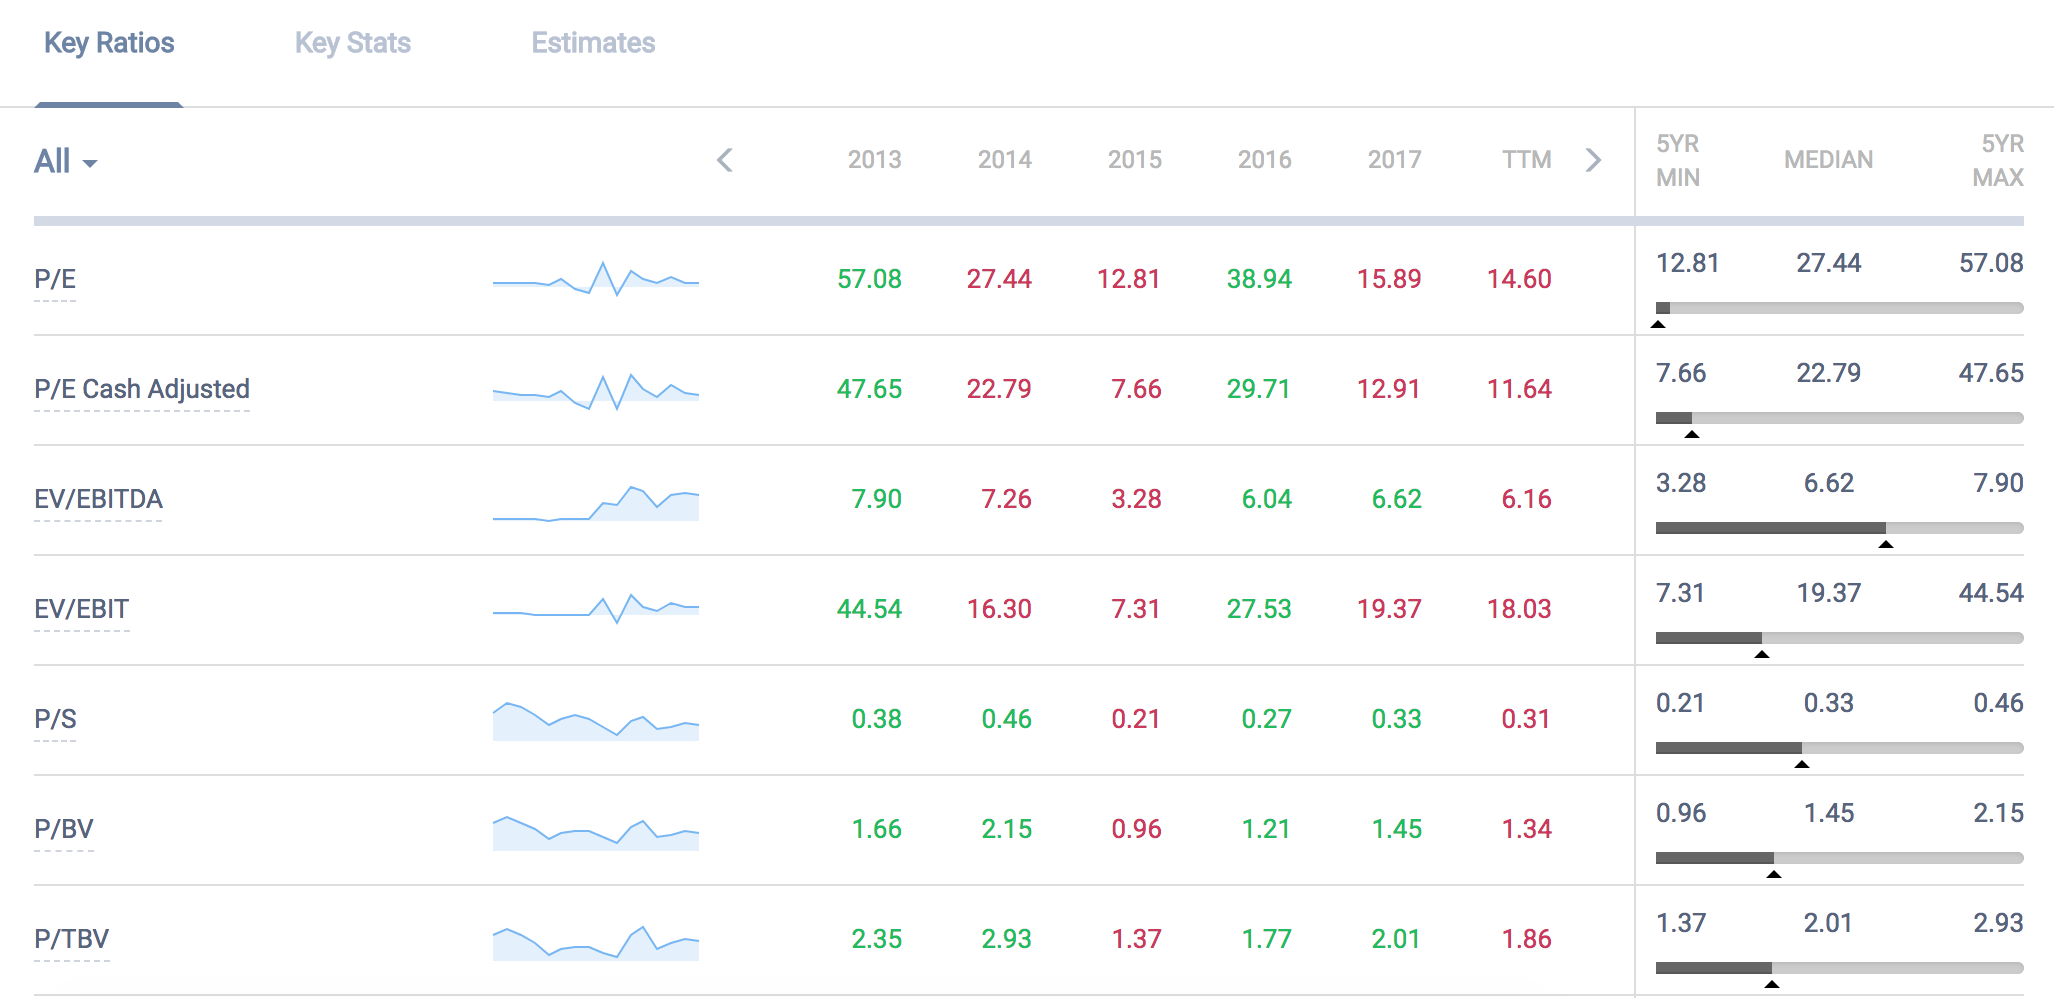
I am wondering you could use Log scale to plot the chart. It helps to see better trends direction and better range of scales of chart pattern particularly when it had historical extreme values. When dealing with negative number, you may treat augment of the log function as a positive, then add negative sign afterwards.

 Problems with Sales Growth on Portfolio Report Views
There seems to be some problems with the data showing sales growth in the portfolio report views. I created a custom report and wanted to show growth values (3 year and 10 year). The values shown seem to be unreliable. For example, on Humana (HUM), both the 3 and 5 year 'Sales Percentage Change Growth' values show as 'N/A'. Other companies also show this problem.
I would also appreciate if the 1 Yr growth rates could be added such as 'Sales Percentage Change 1Yr Growth' and 'Diluted EPS 1Yr Growth', etc.
Thanks.

I suggest adding industry average to key ratio next to company's key ratio performance
after 5yr max, a column showing industry average would be very insightful.

AMZN working capital seems to be off for 2017
Hi there , AMZN current assets on site shows 60.2B and current liability shows 57.8. So, I was assuming I should be getting somewhere around 2.4B. But it shows 11.48 B. Do you use another formula? Many thanks Roy
Please add company CNX
CNX is a NYSE company and it seems to not be in your database. I would love to know what you think about this company.
Thanks,
Roy
Add industry averages for Statement%
When reviewing a company's common sized statements% on the excel sheet it will help to have industry averages to compare performance such as average SGA for an industry. This idea came to me when I was reviewing Statement% and I wanted to know whether the company is paying high SGA or normal SGA.
BTW I like the "Compare Competitors" section very clear, easy to use and to the point as well as the other features. Thank you for this great work.


Best Performing Stocks not in Best Performing Stock list
I have a position in HWCC that is up 40%. Yet it does not show up in the Best Performing Stock list. LZB, is however on list. It is only up 13%. Something wrong here, or am I missing something?
Add annual average return to Portfolio
I would like it if there was a way to easily see the average annual return for x years. As it is now, I have to hold the mouse on the graph from year start and then at year end to see the difference. (Unless I am missing something).

Improve Growth Score Metrics
Jae,
As you know, I sent you the email shown below last week but never received the courtesy of a reply -- so I'll try it here:
I have often used your Quality and Value Scores as good metrics, but never the Growth Score.
This morning provides a good example of why:
BIG just reported earnings and the stock is tanking. Your Growth Score for them is B and here’s two of their 4 metrics:
Sales % Change TTM 0.1%
Sales 5 Yr +TTM CAGR % 0.2%
These sales numbers are anemic (below inflation rate), yet via your Growth Score Guide this is considered a positive growth metric. No way.
A +5% CAGR is much better growth than +0.2% (obviously), and your model needs to be nuanced enough to reflect that.
I hope you are open-minded when it comes to modifying/improving your metrics. If you are, I’d be happy to provide suggested Growth Score improvement thoughts.
Best wishes,
Jeff Partlow
Customer support service by UserEcho
