
 Show the Price CAGR vs Revenue \ Operating Profit \ Net Profit \ OCF CAGR for the pass 1 year, 2 years, 3 years, 5 years, and 10 years.
I would like to suggest to develop a page to show the Price CAGR vs Revenue \ Operating Profit \ Net Profit \ OCF CAGR for the pass 1 year, 2 years, 3 years, 5 years, and 10 years.
With this info on hands, we can check if there is any price value divergence based on the business fundamental vs the price movement

10 year Multi year Performance at a glance as a graph
The multi year performance is great (remember reading about this in F-Wall Street), however it would be nice to be able to switch to or see the actual numbers for the last 10 years as a graph.
Value: It would make it possible to form an opinion on how stable the company is at at glance and if the numbers correlate the way one would expect them to.
Possible use:
Phil Town talks about how he use certain growth values to indicate a company's moat. From his Rule one website:
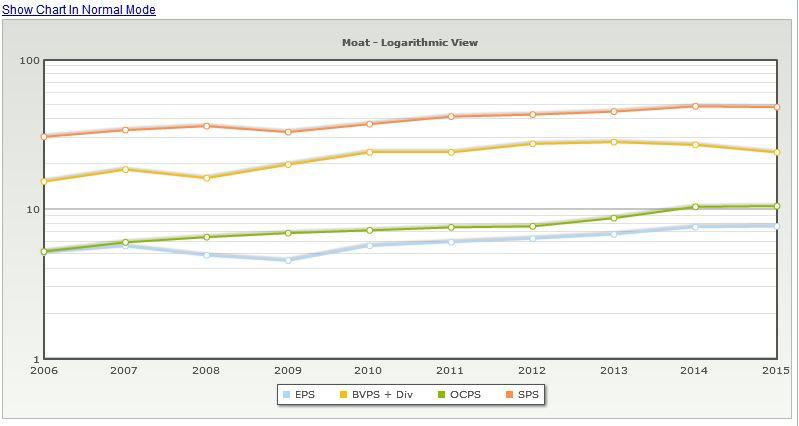
Companies that have had a sustainable moat usually demonstrate consistent increase in the growth of Earnings per Share (EPS), Sales per Share, Book Value per Share (BVPS), and Operating Cash Flow per Share (OCPS). Review these numbers and charts to determine if
this company has had a sustainable advantage over its competition in the near past."
On his checklist he checks that all these growth rates have been above 10%, and he talks about how he use this to trigger questions if these graphs aren't parallel.
With the multi year performance it's easy to see the number by it self, but it's not seen at a glance how one number develop compared to another number.
I gave this as an example. I am sure others have other numbers from the performance table they would like to look at as well. (I know I do).
The graph would be laid out as years on the y-axis and % on the x-axis and the graphs would have different colors (I guess) for the different performances.
Like this: This is 3M. If the lines started to cross each other, I'd want to know why.


Default For DCF Calculation
Jae, I'd like the ability to use free cash flow as my default calculation, not net income, during my initial review of a company's DCF valuation.
show the numbers used in the growth calculations
display growth numbers used for the DCF and Graham calculation in each respective section.


keep tabs or company name at the top of the page while scrolling down
Want to see the name or the symbol of the stock without having to scroll back to the top.


 Your reported Cashflow From Operations is markedly different than what's reported in their 10Ks; why?
For example, you report CFO for 2020 as 1.01B; 10K reports as $1.7B. Other years are similarly different. Why?
Customer support service by UserEcho
